Quickly check the website framework and CDN integration results
Quickly check the Framework that the website uses
Frameworks are pre-written code segments that constitute a basic structure and packaged programming libraries. They provide ready-made features such as models, APIs, and other elements to minimize the effort required to develop rich and dynamic web applications.
There are many ways to check the website framework, but the simplest is to use the Wappalyzer extension on Google. Download here
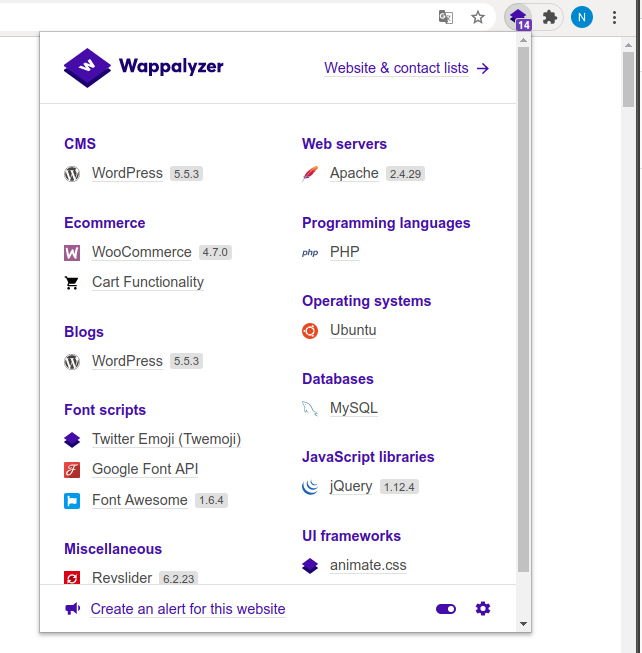
- Step 1: Access the website on a browser with Wappalyzer installed
- Step 2: Select Wappalyzer in the area Extensions, the website information as well as the Framework used will be displayed in full
Check CDN integration results directly on the Browser
Step 1: Access the website using any Browser
Step 2: Press the F12 key or right-click and select Inspect
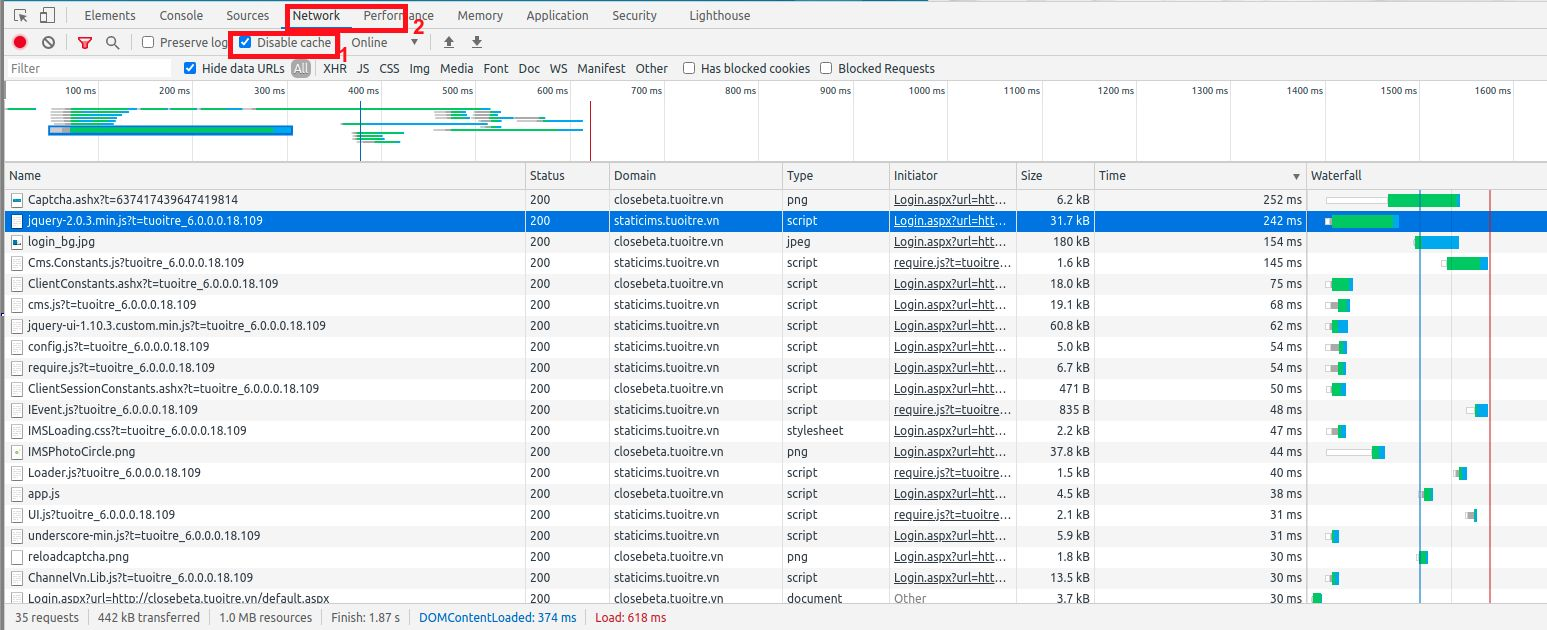
Step 3: After the “Inspect” task appears:
- Select “Disable cache” to bypass the browser cache.
- Select “Network”
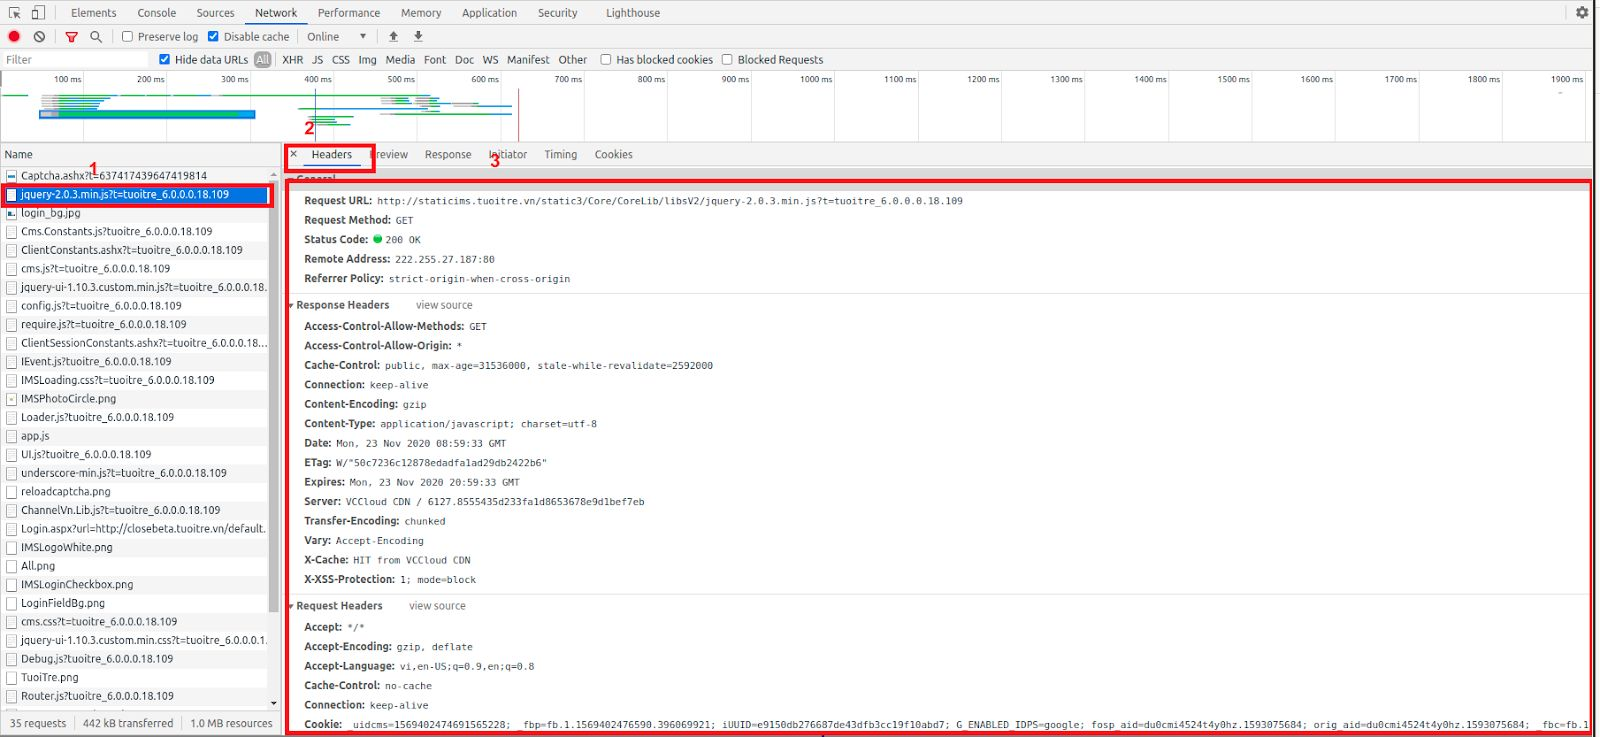
Step 4: Select an IMAGE, JS, or CSS file, then check the Header and Response Header to see if it was served from the CDN.
Step 5: Check Timing
See more about Timing here

How to identify the causes of slow access from the user’s Web Browser
Press F12, select the Network Tab to view the processed requests. Successfully processed requests will have a return code of 200 (Status column), while failed requests will have return codes of 401, 403, 404, 500, 501, 502, 504…
Stalled time
-
Indications
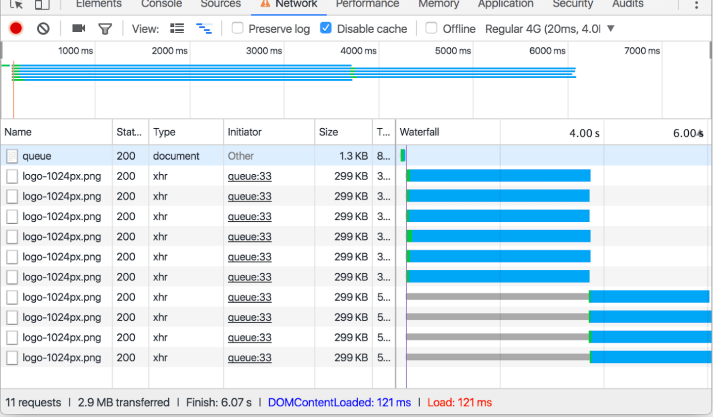
- View the Request line with a long processing time; in the Waterfall column, there is a long gray Stalled time (several seconds or more).
-
Causes
- The browser cannot process multiple requests simultaneously to resources running on the same domain, for example, loading many js, css, and image files at once, so it will push the requests into a queue. If the processing of requests in the queue is slow (due to network or slow processing device), it will lead to a high Stalled time.
-
How to handle
- Check if the computer/device is low on RAM or is processing any heavy tasks.
- Refresh the browser to see if the high Stalled time persists.
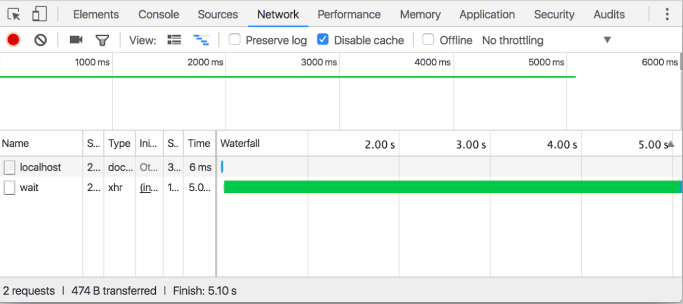
Slow - TTFB time
-
Indications
- View the Request line with a long processing time; in the Waterfall column, there is a long green TTFB time (1s or more).
-
Causes
- Slow connection from browser to server
- Slow server processing of the request
-
How to handle
- Check the network connection on the user’s side.
- Check the processing speed on the service server side.
Downloaded time
-
Indications
- View the Request line with a long processing time; in the Waterfall column, there is a long blue Downloaded time (1s or more).
-
Causes
- Downloading data simultaneously from multiple requests, requesting many large-sized resource files (Image with large size > 1-2 MB)
- Slow and unstable network quality at the user’s office
-
How to handle
- Recheck the network quality at the user’s office
- Optimize and reduce the output size on the service server side, for example, compress images to reduce their size more
How to identify the causes of freezing and lag, preventing interaction with functions on IMS
- Press F12 , select the Console Tab to see if many errors are being output; errors caused by faulty JavaScript processing can cause the browser to freeze and become unresponsive.