How to Use the Database Query Analytics Dashboard
Bizfly Cloud Database is a service that provides database solutions on a cloud computing platform, helping users and businesses implement an effective data management solution, ensuring data integrity recovery in disaster scenarios. It also monitors information related to users’ database management systems, automatically adjusting data storage capacity according to the resource usage needs of the database management system.
Bizfly Cloud Database is a free service provided by Bizfly Cloud during the Beta and trial period. The information related to usage costs is for reference only.
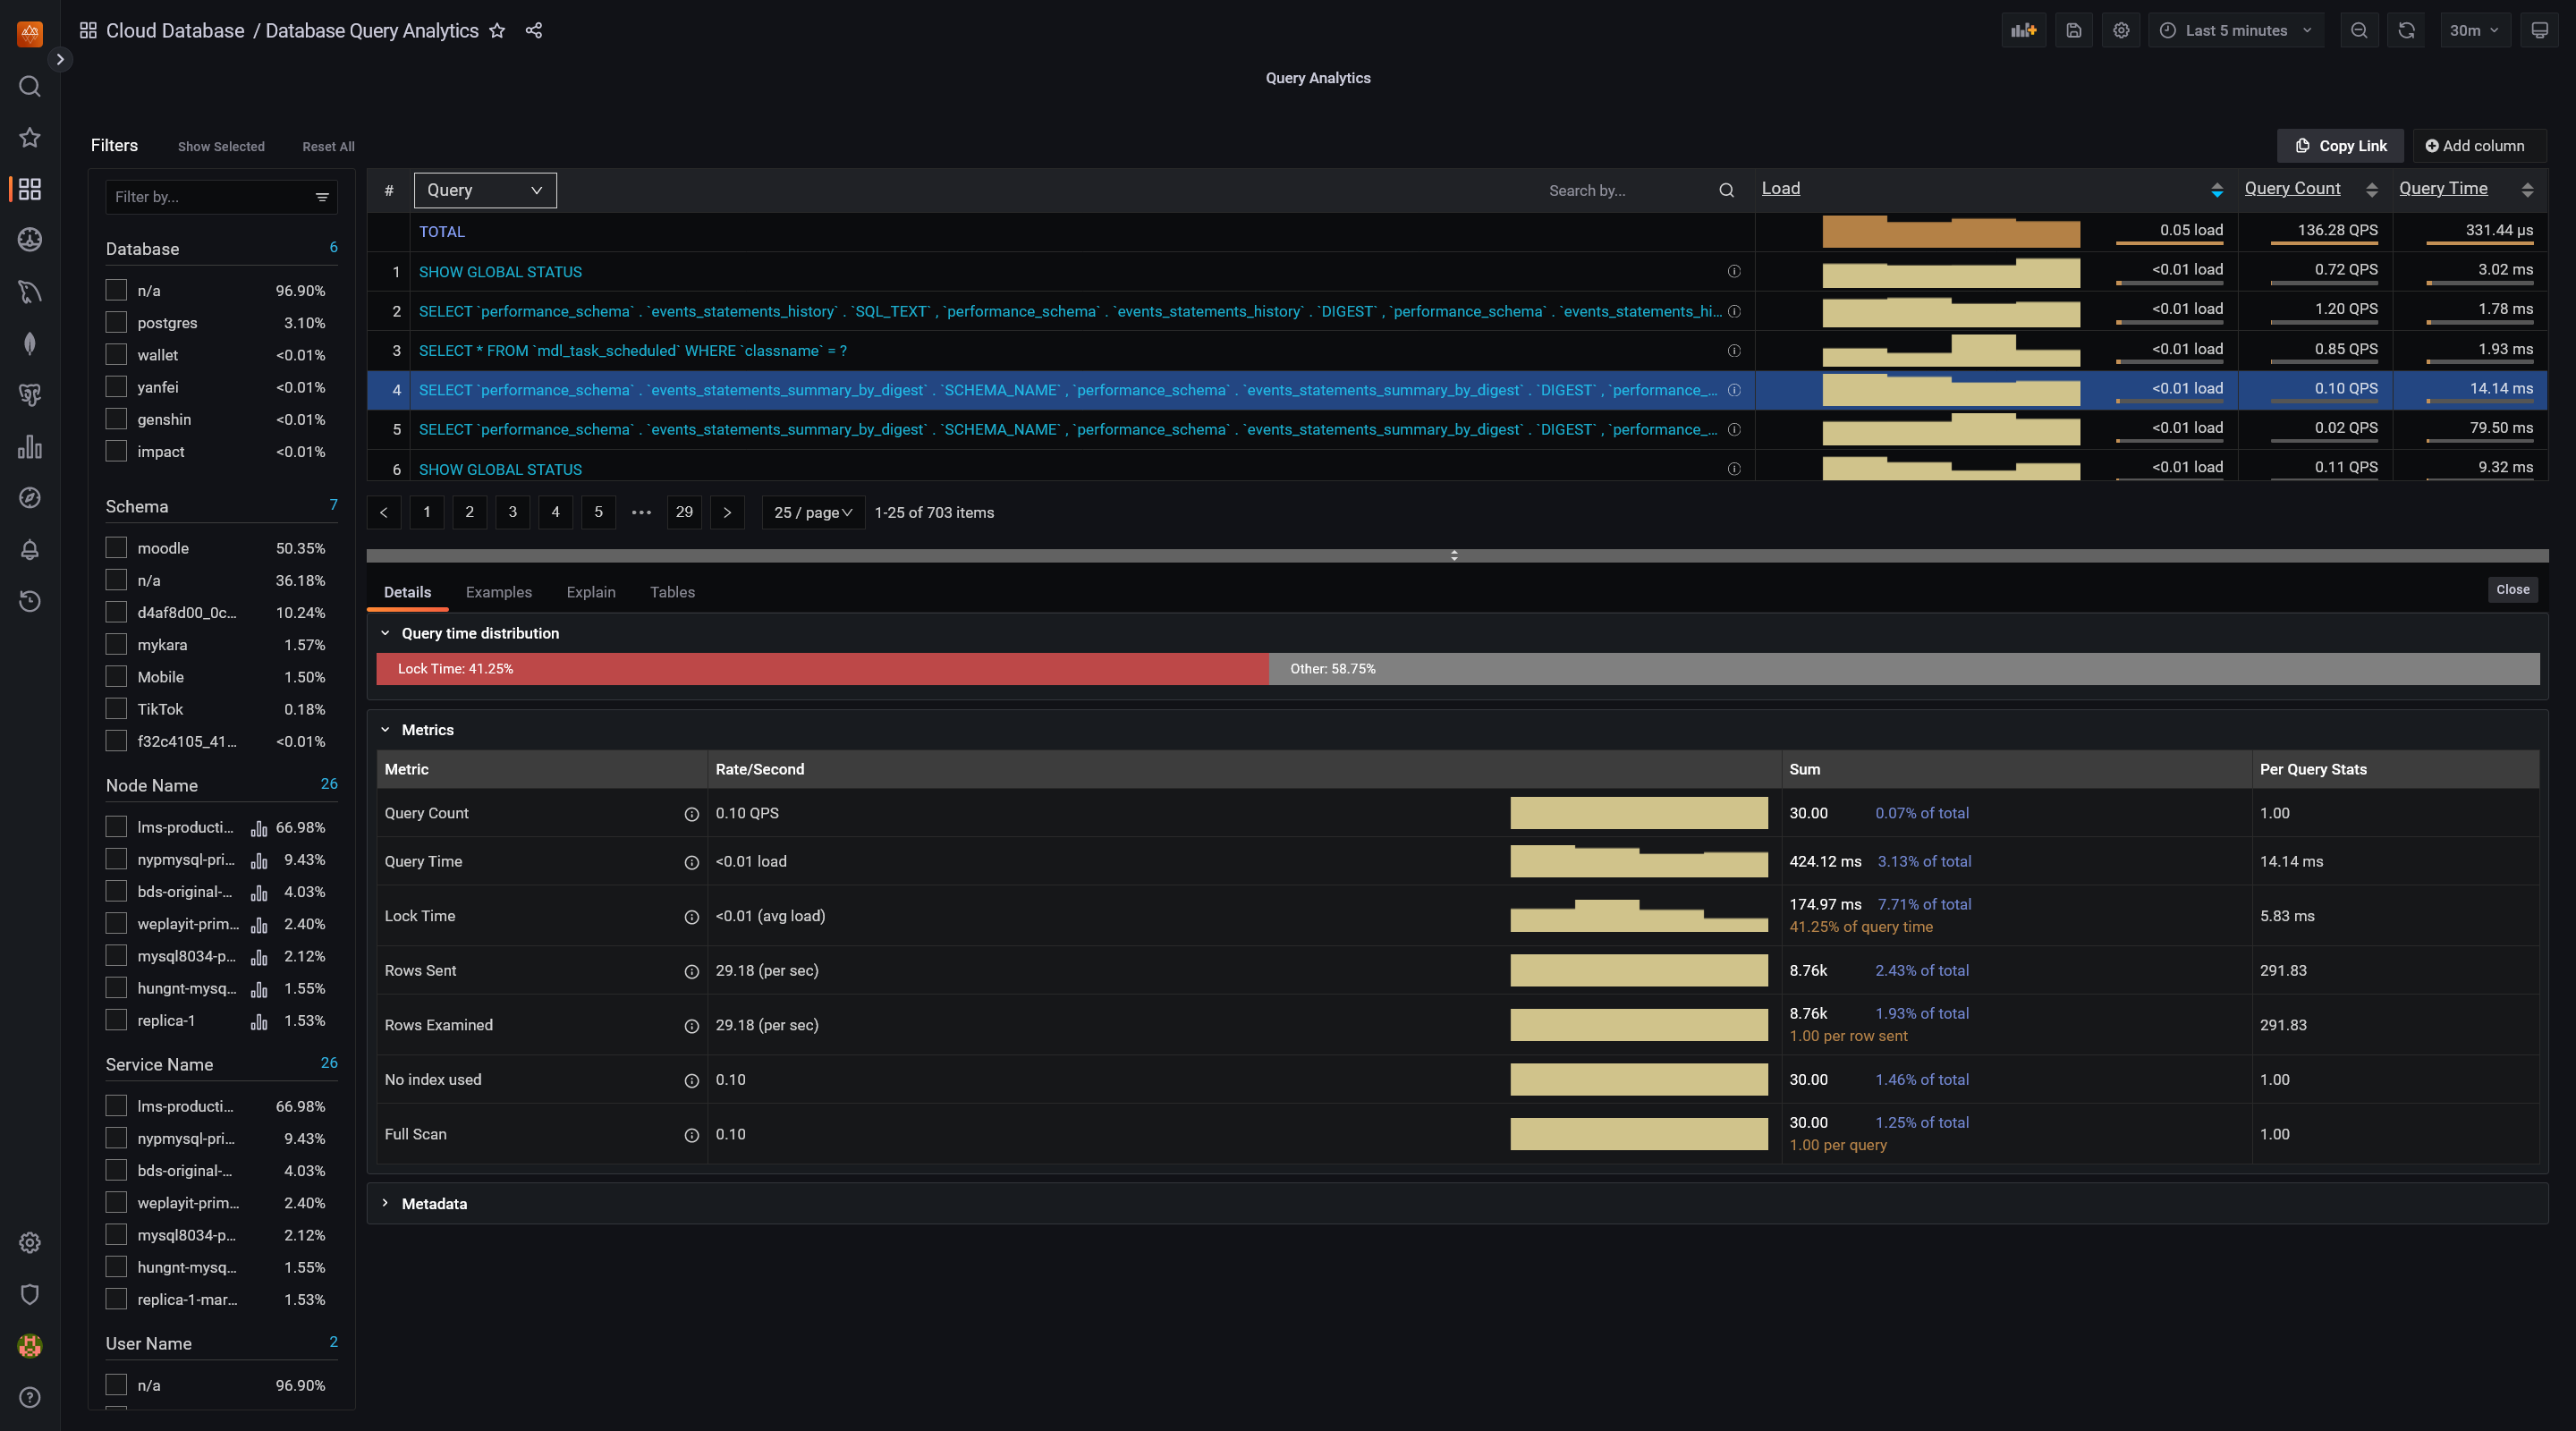
Introduction to the Query Analytics Dashboard
The Database Query Analytics Dashboard provides customers with a dashboard to monitor how queries are executed and where they spend their time. It allows you to analyze database queries in real-time, optimize database performance, and identify and resolve the root causes of issues.
Note: To use this feature, users need to actively configure the dashboard to collect metrics.
How to Use the Query Analytics Dashboard with MySQL/MariaDB
To use the Query Analytics Dashboard for MySQL/MariaDB, users need to configure the dashboard to collect metrics through the option: performance_schema with the corresponding descriptions as follows:
-
To allow collecting metrics (This is the default value)
Parameter Value Requires Restart performance_schema ON Yes -
To disallow collecting metrics
Parameter Value Requires Restart performance_schema OFF Yes
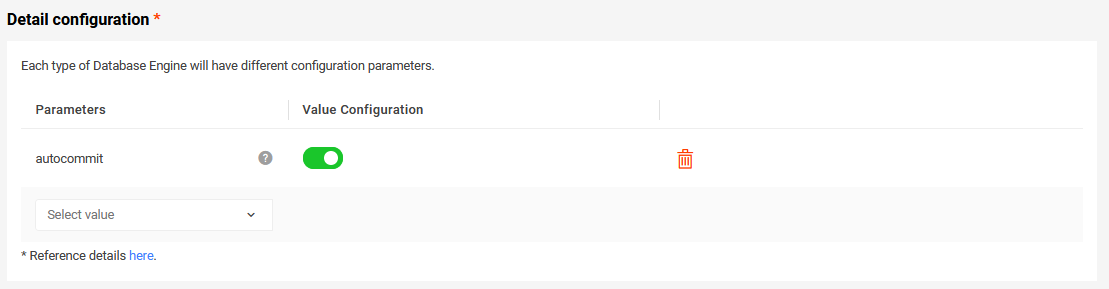
Users can configure this through the dashboard interface using the following configuration parameters:
-
To allow collecting metrics (This is the default value)
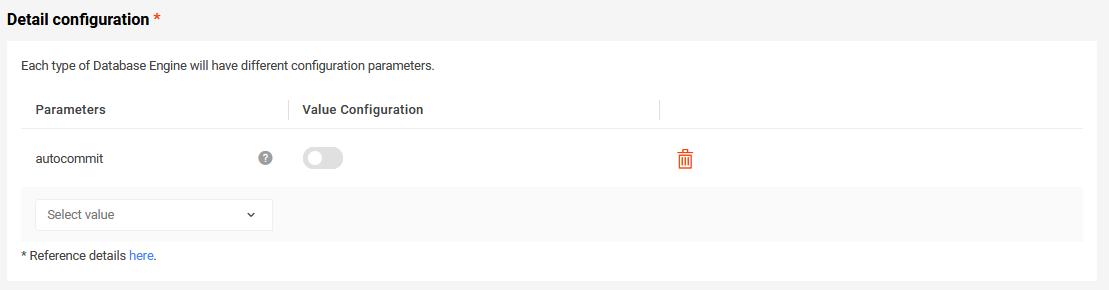
-
To disallow collecting metrics
How to Use the Query Analytics Dashboard with MongoDB
To use the Query Analytics Dashboard for MongoDB, users need to configure the dashboard to collect metrics through the following options with the corresponding descriptions:
-
To allow collecting metrics
Parameter Value Requires Restart operationProfiling.mode “all” Yes operationProfiling.slowOpThresholdMs 0 Yes -
To disallow collecting metrics
Remove the configured options above from the configuration parameter groups currently set for the database nodes.
How to Use the Query Analytics Dashboard with PostgreSQL
To use the Query Analytics Dashboard for PostgreSQL, users need to configure the dashboard to collect metrics through the following options with the corresponding descriptions:
-
To allow collecting metrics
Parameter Value Requires Restart shared_preload_libraries “pg_stat_statements” Yes Since the
shared_preload_librariesoption allows configuring multiple values simultaneously, users need to be flexible in their configuration based on the existing values.After configuring the above option and applying it, users need to configure each individual PostgreSQL database. To do this, access the database that needs configuration and create the extension for that database. For example:
\c characters CREATE EXTENSION IF NOT EXISTS pg_stat_statements; -
To disallow collecting metrics
Remove the configured options above from the configuration parameter groups currently set for the database nodes.